The Shell Game
How to take messy corporate pollution data and make it, dare I say, beautiful
Today’s post includes:
An exploration of Shell (the oil company)’s random, unstructured, and generally unhelpful data on oil spills
How Pandas (the Python package) can make data scraping really easy
Some brief data exploration and cartographic visualizations of oil spills in Nigeria
Greetings all! I’m feeling a little big for my britches because the other week, I found out my story The Big Oil Spill(s) won Sentinel Hub’s best written story award in their 2021 Urban Growth in Africa custom script contest. In the piece, I used Sentinel-1 SAR data to illustrate the spread of two oil spills off the coast of Nigeria. Today, I want to expand on that post a bit and show how ugly data published by Shell themselves can be whipped into something useful.
Shell, as a multinational oil company with branches and subsidiaries all over the world, publishes information about oil spills from the company’s equipment and facilities in Nigeria. Before I go on, let me be absolutely clear that this is a good and laudable thing to do and more companies should do the same!
However, I’m forced to conclude that either the IT peon who built their oil spills site is an absolute ding-dong or Shell doesn’t actually want users to derive any interesting information from their site because the site is hard to read, hard to access, and nigh on impossible to use to figure out long-term trends or aggregate insights.
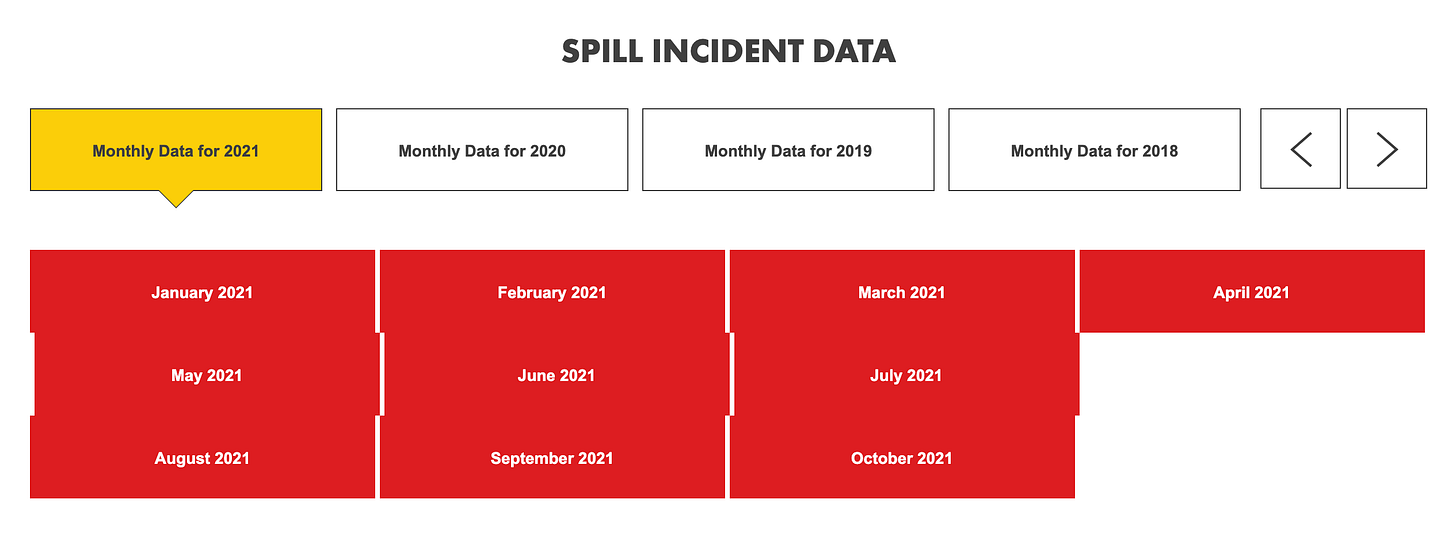
The site, linked here, looks like this:
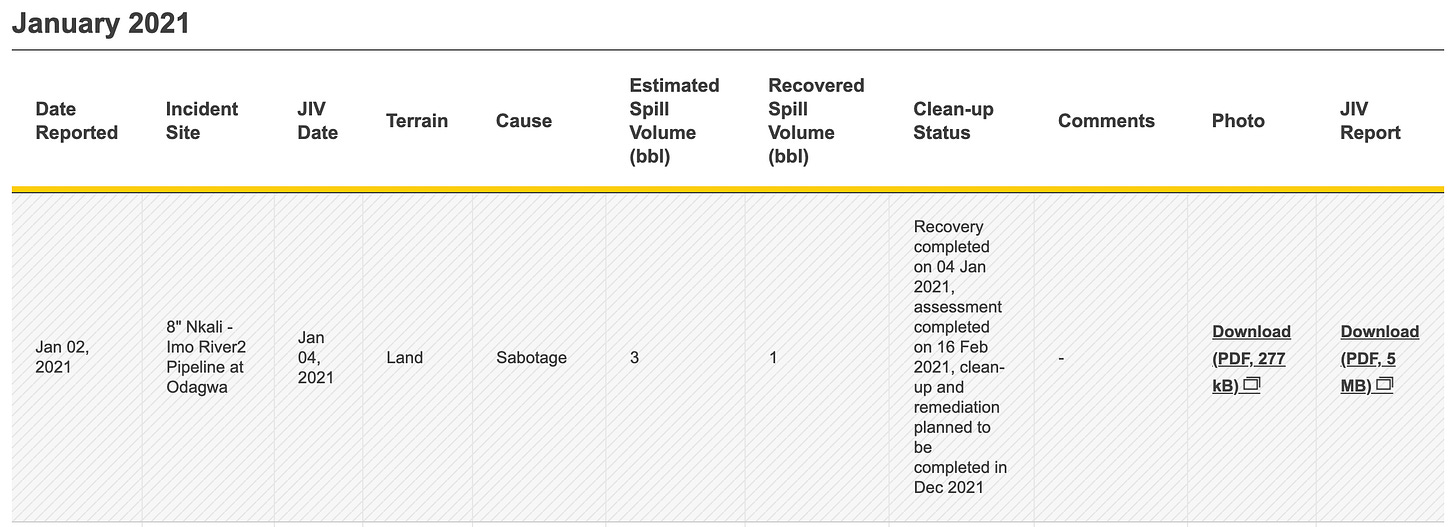
You have to click on the year and the month you’re interested in and then scroll down to a table where you’ll see monthly spill data presented in rows too chunky to see more than one or two at a time.
I decided something had to be done about that.
On the bright side, the URL of each monthly site tells us these tables are in HTML format, which means the site is structured in a basic, logical, and static format with little extra functionality built on top (read: easy to scrape).
https://www.shell.com.ng/sustainability/environment/oil-spills/january-2021.htmlOn the less bright side, there are over 100 separate sites of pollution data. Shell has published oil spill information since 2011 and, given a separate page for each month and 12 months per year (although only 10 months so far in 2021), that comes out to exactly 130 sites I would need to scrape.
Fortunately, each site follows a standard naming convention:
https://www.shell.com.ng/sustainability/environment/oil-spills/[MONTH]-[YEAR].htmlSo, instead of typing out 130 URLs by hand, which would probably cast me into a deep depression, I wrote a quick Python snippet to concatenate the months and years into a unique URL for each site:
Next, I took advantage of a Python/Pandas command that I honestly did not know existed until about two weeks ago:
pandas.read_html()As the name suggests, it reads files, URLs, or anything with HTML text into a list of DataFrames, which you can then manipulate or analyze to your heart’s content. In other words, using this command removes the need to do any complicated scraping, element identification, or annoying formatting - it does all that for you. I passed my list of URLs from the first step to this command and there, in a matter of seconds, were all of Shell’s Nigerian oil spills in one place.
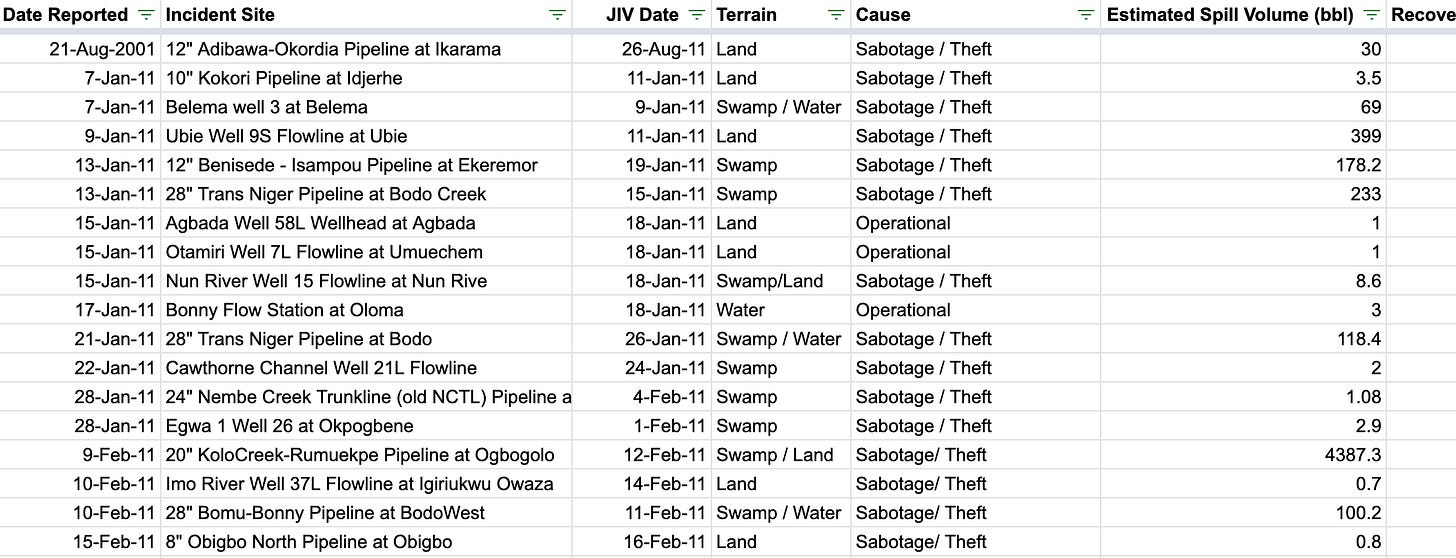
I concatenated that list of DataFrames into a single DataFrame, saved it as a .csv file and opened it in Google Sheets to admire my handiwork.
I’m going to save the Actual Data Analysis for another piece, but, just as a taste, here are some juicy details that pop out at first glance.
First of all, the data in aggregate is incredibly interesting. Shell recorded 1,592 separate oil spills in Nigeria since January 2011, totaling just over 183,000(!) barrels spilled. Shell says that the vast majority (1,333) of the spills were caused by “sabotage” or “sabotage/theft”. The remainder were either “operational” spills or the confidence-inspiring “mystery spill”. The average spill size across causes is 115 barrels.
Secondly, I have some ~questions~ about how Shell is recording their spill data. For instance, I have a hard time believing that in Nigeria’s incredibly complicated and remote pipeline network, the company was able to detect multiple spills that had between zero and one quarter gallon1 of oil spilled.
I’m also skeptical of the company’s assertion that 84% of the spills were caused by theft or sabotage, especially considering the rugged territory in which the majority of the country’s oil infrastructure is located2.
Lastly, I took a quick run at mapping the spill locations. I tried two methods: Google Earth’s built in geocoder and a GeoNames database accessed through Python. To prepare the data for mapping, I first noticed that in the Incident Site column, the locations all follow a common format: "[Pipeline size] [pipeline name] at [location]”.
I split the [location] section into a separate column and added “, Nigeria” to each one, like so:
I loaded that into Google Earth, asked Google to predict locations for each line, and got this map:
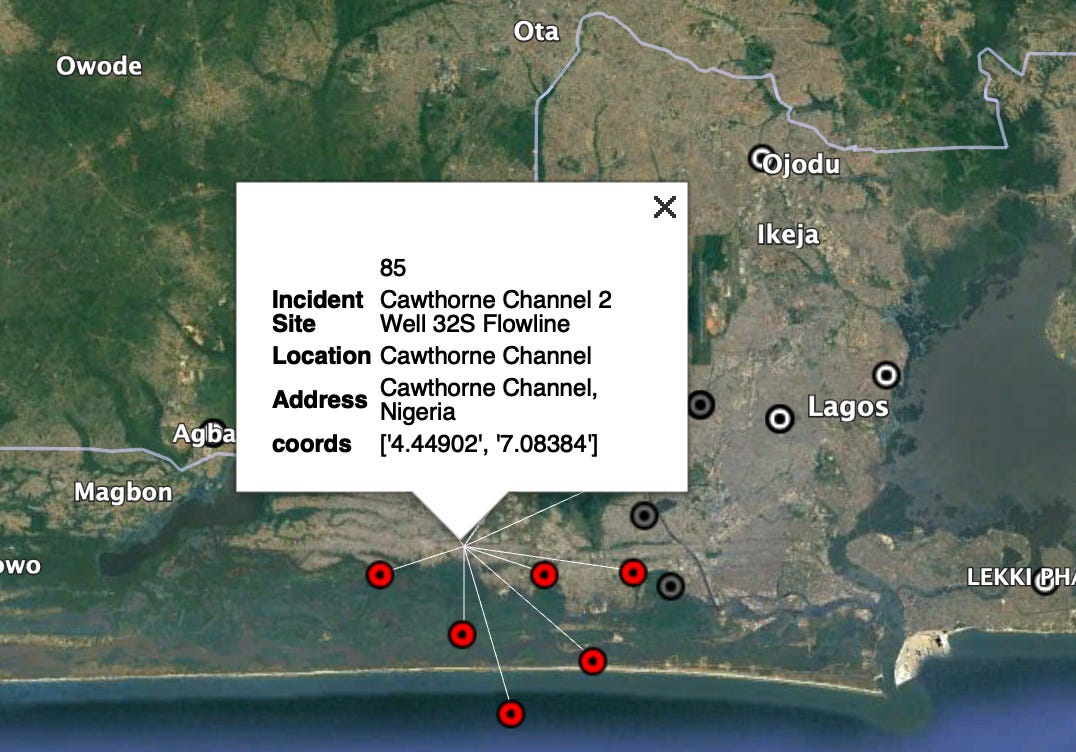
Looks good at first pass but, upon digging deeper, many of the locations are plainly wrong. Take this cluster of spills that Google predicted as southwest of Lagos:
The spills were actually in the Cawthorne Channel, which, in reality, is hundreds of miles away from the Google predicted location.
The GeoNames approach fared better. I imported their Python package, calculated the latitude and longitude for each spill location, and saved them in a new column.
I plotted those lat/longs in Google Earth and got the map below:
While there are fewer pins in the GeoNames map, they seem to be more accurate. GeoNames, for example, correctly plotted the Cawthorne Channel spills:
Anyway, I hope this was an instructive look at how to take messy corporate data and turn it into something interesting and useful. If you want the data set I compiled, I’m happy to pass it along - just email me at lineofactualcontrol@protonmail.com. And don’t worry, more analysis of this data will come in future pieces. Thanks as always for reading!
I don’t think it’s particularly realistic to imagine anyone could detect a milk-quart volume of oil disappearing from a pipeline network as complicated as this.
Not to mention the extremely infirm nature of many of these pipelines.


