This open source investigation comes with a topical soundtrack. If you like the song and/or the article, consider subscribing or sharing! One more thing: all SAR images in this piece are courtesy of Sentinel Hub’s EO Browser. Their free, easily-accessible imagery is unparalleled.
On Friday, January 28th, a Dutch court ruled that the oil company Shell is financially responsible for the damages suffered by Nigerian farmers whose land was affected by the company’s oil spills. In the wake of that decision, I decided to use open source techniques to try to determine the extent to which oil spills have damaged Nigeria’s coastline.
What I found astounded me.
At least one pipeline off the coast of Nigeria has been leaking oil uninterrupted since August. Another platform, leaking since December, has affected both coastal mangrove swamps and fishing grounds on the high seas. Together, spills have caused hundreds of kilometers’ worth of oil slicks.
Why SAR Imagery?
To measure these spills, I used a custom script applied to Sentinel-1 imagery. (For more on Sentinel-1, check out my other piece from October about using the imagery in Kashmir). Sentinel-1 uses Synthetic Aperture Radar (SAR), which is an instrument that shoots radar beams at the earth and uses the rebounding beams to create a picture of the terrain.
Since it relies on radar waves rather than visible light waves, an SAR satellite can image the earth day or night, rain or shine. These qualities have made SAR imagery a valuable tool in tracking environmental degradation in rugged, remote locations, among many other uses.
I chose Sentinel-1 imagery for this project because when looking at coastal oil spills using conventional satellite imagery, it’s incredibly difficult to differentiate the grayish-blue oil spill from the grayish-blue sea.
There is an oil spill here, but there are also shadows from clouds, sediment from a river, waves, and mud from a dredging operation. Can you tell which is which?
SAR imagery, on the other hand, observes the qualities of the surface of the water, rather than the color of the water. As “luck” would have it, oil spills absorb the energy of ocean waves. Oil, in comparison to normal seawater, also prevents wind from gaining traction over the surface of a spill. These two factors mean oil slicks smooth waves out and actually calm the surface of the sea. In fact, to take advantage of this effect, ships used to carry what was known as “storm oil” - oil that sailors would release from a container to calm the sea around the vessel during a storm. As a result of this smoothing effect, according to a paper in Comprehensive Remote Sensing, oil slicks “appear as dark streaks or dark patches…on SAR images”.
In the SAR version of the same image above, the black streak of the oil slick is clear as day.
If you couldn’t pick out the oil slick on the true-color image, don’t worry, I couldn’t either. If you can’t pick out the oil slick on the SAR image…maybe get your eyes checked out.
As good as the SAR image is, we can make it even better. In particular, I want to use a custom script to colorize the image in order to show the difference between the oil slick, the ocean, and the land.
I researched some of the custom scripts available for Sentinel-1 imagery and discovered a really good Water Surface Roughness Visualization script.
var val = Math.log(0.05/(0.018+VV*1.5));
return [val];
Credit: Annamaria Luongo
Unfortunately, although this script shows the difference between the oil slick and the water really well, it still renders the image in grayscale.
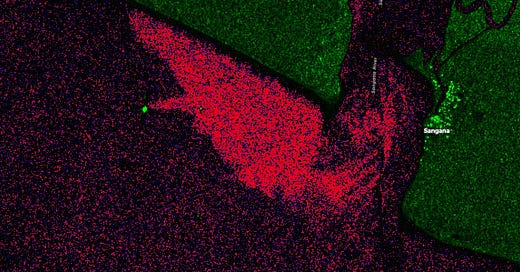
I modified the script slightly to introduce a threshold into the section of the code that identifies the oil spill. Any pixel that meets that threshold would be returned in red, while the other elements of the image (ocean and land) would be returned in blue and green, respectively.
var spill = Math.log(0.05/(0.018+VV * 3.5));
if (spill > 0.35) {
  return [1,0,0]
}
{
return [0, VV * .7, spill * 2] }
Unfortunately, some pixels showing the normal ocean also meet the “oil spill threshold” - think areas of the ocean that are flatter and may resemble oil spills to an SAR satellite: perhaps areas between waves or areas that don’t have a breeze blowing over them.
Nonetheless, I think the image looks pretty cool, despite the red-speckled ocean.
With the script finished, I moved on to my analysis.
The Spills
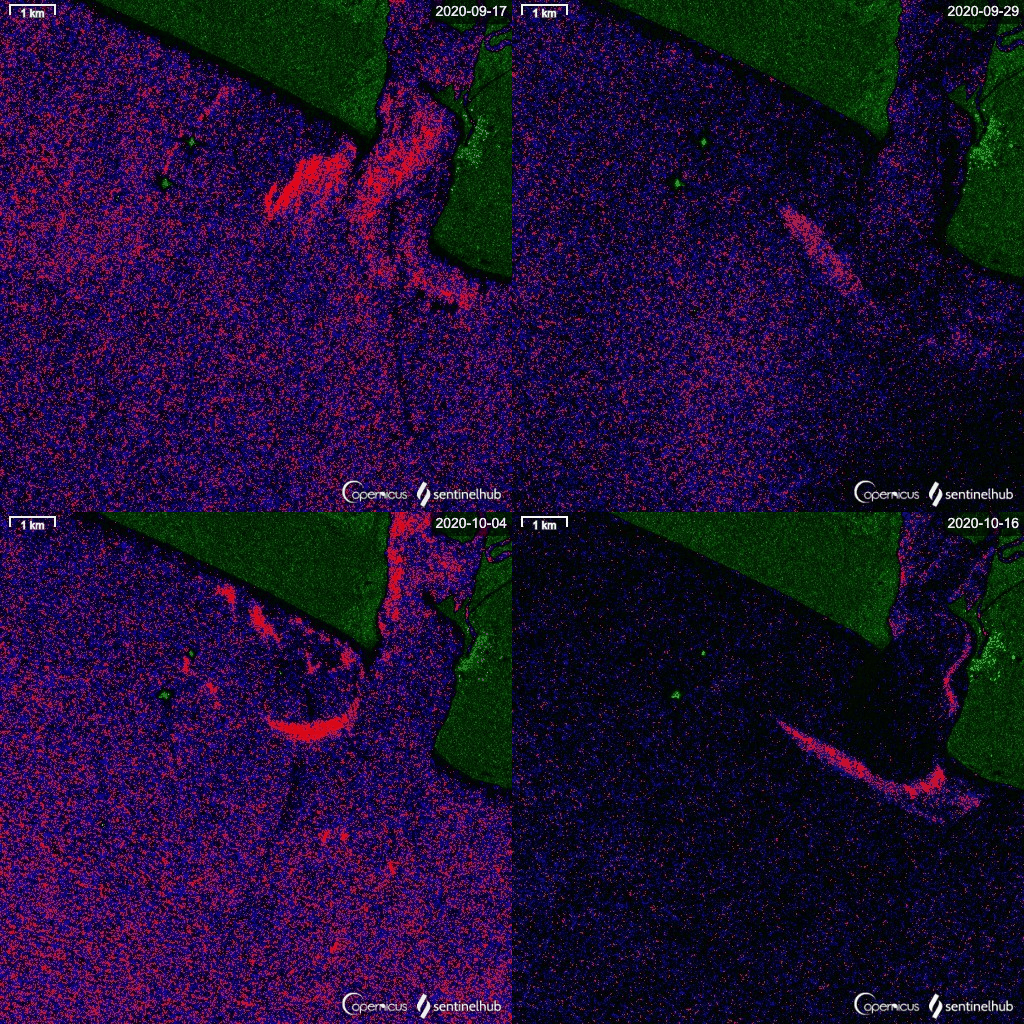
The first spill appeared off the coast of Sangana, Nigeria between August 24th and August 29th, 2020.
An image from August 29th shows the slack water caused by the first oil spill in the area.
The two green dots in the image above are oil platforms. Since there is no green dot near where the bulk of the spill occurred, the spill may have been caused by a broken undersea pipeline that connects one of the platforms to the mainland. This theory is borne out by successive satellite images.
Note how in the time-lapse GIF below, the spills all come from one spot.
An underwater pipeline must have broken and leaked oil, which continued off Sangana for the next few months. As bad as that leak was, it was only the first of a one-two punch that landed squarely on the environment and livelihoods of the Niger Delta.
The second spill was first seen in SAR imagery on December 3rd, 2020. This time it came straight from one of the platforms seen in the previous images.
A December 3rd image shows the two leaks - the southern one from the pipeline and the northern one from the drilling rig.
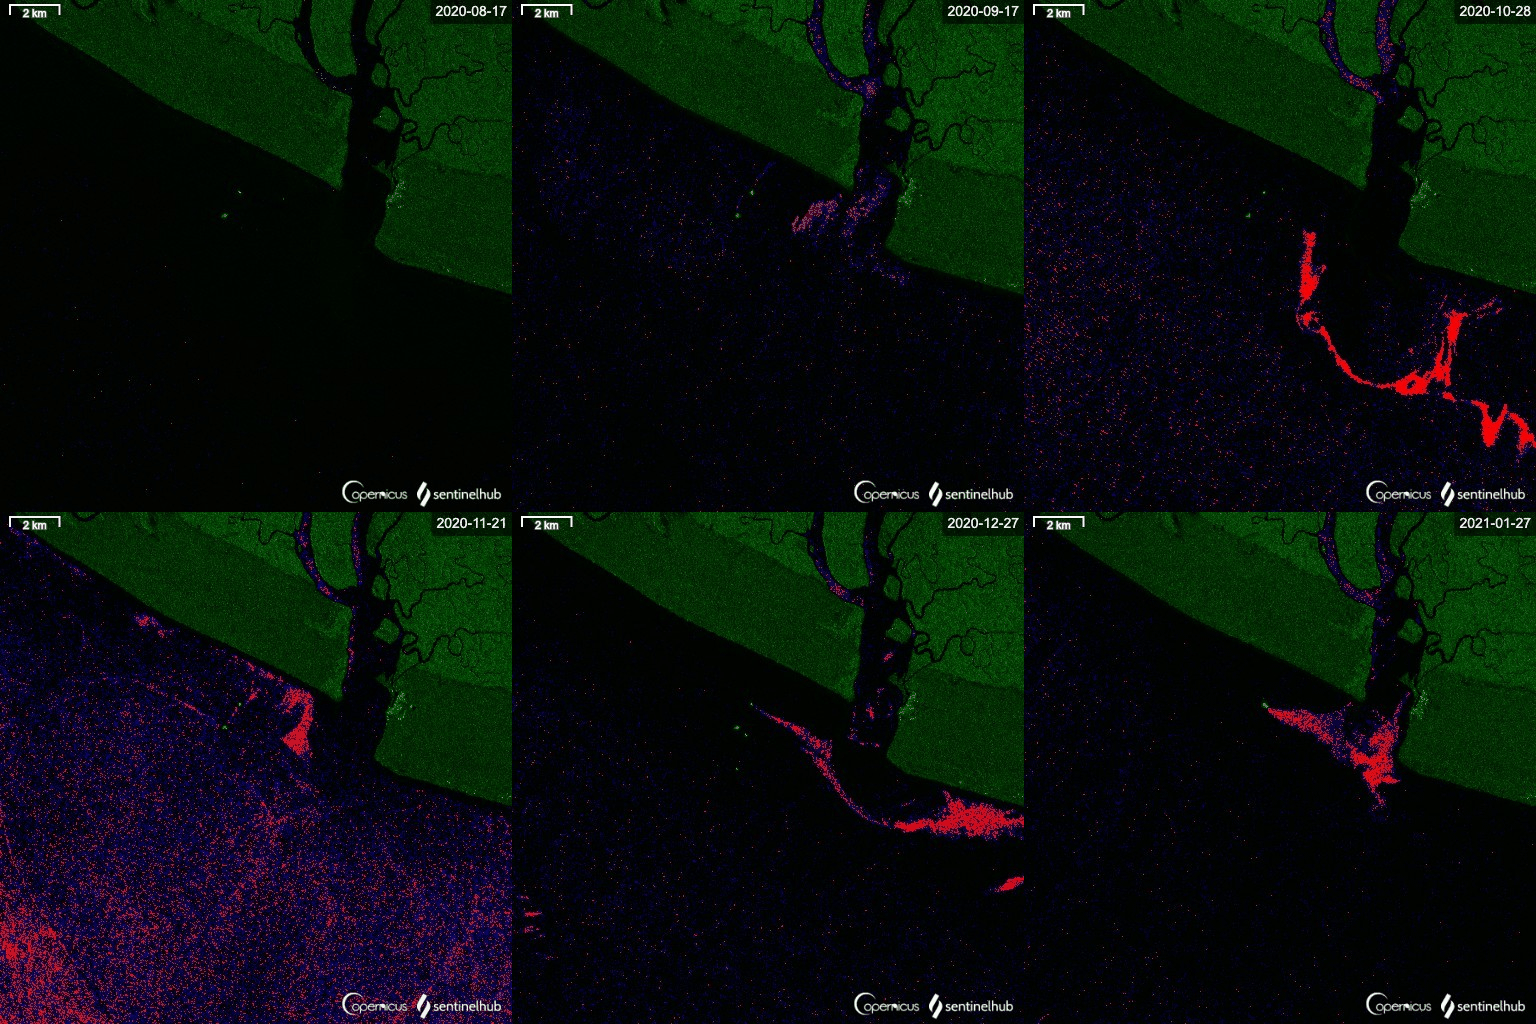
At first, the spills did not cover a particularly large area - about three square kilometers, by my count. However, by the end of December and beginning of January, they became catastrophic.
This incredibly bizarre-shaped spill reached about 20 square kilometers on January 20th.
Even worse, these breaches have been constantly spilling oil. This GIF, made of a composite of SAR images since late August 2020 shows just how disastrous these spills have been for the Nigerian coastline - from bare wisps of oil in September to full blown sheets blanketing the area by January.
The final question is attribution. Who is responsible for these spills? The first spill, from the pipeline, is difficult to attribute because there aren’t many maps or clues about the underwater pipeline infrastructure in the area. However, according to a map by Tros Offshore, the spills occurred in Oil Mining License 59, which is owned by ConOil - a large Nigerian petroleum products firm.
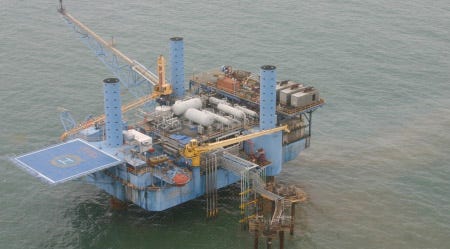
Responsibility for the second spill, from the oil platform, is easier to determine. As with the first spill, it occurred in ConOil’s Oil Mining License 59. I searched for oil platforms in OML 59 and ConOil themselves confirmed that a Mobile Offshore Production Unit named Auntie Julie operates there.
ConOil’s Auntie Julie platform in OML 59. Credit: ConOil
Could that be the platform leaking like a sieve? The most recent imagery shows that whatever is leaking is located 3.91 kilometers from the nearest headland.
Google Earth imagery from December 2019 shows an oil platform also located 3.91 kilometers away from the same headland.
Zooming in shows that this platform is undoubtedly ConOil’s Auntie Julie Mobile Offshore Production Unit.
The features from the satellite image (top) are a clear match to the same features on the picture of Auntie Julie provided by ConOil (bottom). The match indicates that ConOil is responsible for at least the second (and more severe) spill affecting the Niger Delta.
These two spills are not isolated incidents. A quick Google search shows dozens, if not hundreds, of oil spills both on land and off the shore of Nigeria. Whatever the root of the spills are - militant attacks, theft and sabotage, or incredibly shoddy maintenance - they’re spoiling the Nigerian environment for years to come.
The two spills that I examined here caused a few hundred square kilometers worth of oil slicks. Magnifying the scale of these two spills across the entire country suggests that oil companies are likely causing thousands and thousands of square kilometers of oil slicks on the Nigerian mainland and in the country’s coastal waters. Fortunately, SAR imagery is an invaluable resource for identifying these spills and ultimately holding the polluters accountable.


