Starbucks' Crime Claims
Starbucks says they closed branches this summer due to high crime. Municipal data tells a different story.
Highlights from today’s post:
Public crime data from Los Angeles, Portland, and Seattle showing that crime probably isn’t the only reason Starbucks closed branches in these cities
Spreadsheets, Python, maps, and graphs
Today’s post involves a decent amount of geocoding — turning human-readable street addresses into machine-readable coordinate pairs. There are a lot of services that do this, but OpenCage in particular operates a highly available, simple to use, worldwide, geocoding API based on open data. If you often need to geocode (or reverse geocode!), then try their API now on the OpenCage demo page.
On July 11, two Starbucks senior vice presidents sent a letter to employees. The letter outlined the measures the company would take to address challenges like “personal safety, racism, lack of access to healthcare, a growing mental health crisis, rising drug use, and more” in Starbucks stores. Tucked away in the middle of the letter is the detail that Starbucks may begin:
Modifying operations, closing a restroom, or even closing a store permanently, where safety in the third place is no longer possible
In practical terms, this announcement meant Starbucks would close 24 stores countrywide, allegedly due to high crime, in several waves over the summer and fall.
Customers and employees alike expressed bafflement at these closures. As the Willamette Week pointed out:
Starbucks’ decision as to which shops to close remains mysterious. Nine other Starbucks operate within a mile of the doomed downtown location; two are less than a couple of blocks away. A Starbucks kiosk operates inside the Fred Meyer across the parking lot from the Gateway store.
And while some employees acknowledged concerns around crime and drug use, many said they never felt unsafe at work. To their (scant) credit, Starbucks said employees affected by closures would be moved to other branches.
So what gives? Was Starbucks closing crime-ridden stores? Were they trying to squash nascent labor organizing1? Was this an easy way to offload low-performing branches? To answer some of these questions, I examined public data for three cities in which Starbucks cafes closed over the summer: Los Angeles, Portland, and Seattle.
Each city has a robust public data program, with hefty datasets about crimes, police calls, and other disruptions easily accessible on their websites. Each city also hosted several Starbucks branches that closed over the summer. LA had six branches close, Portland had three close, and Seattle had five close.
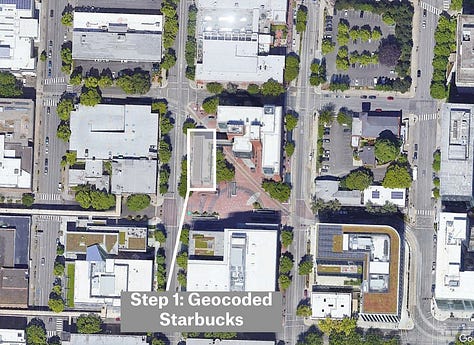
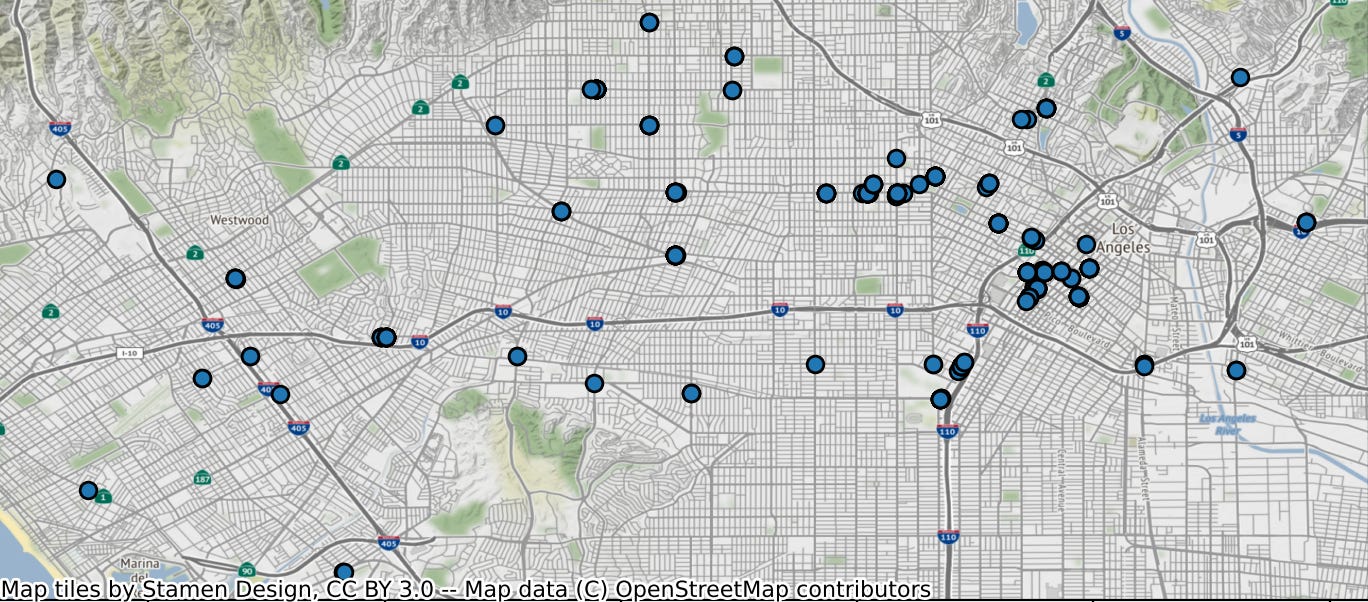
My process varied slightly for each city but the rough outline was the same. I started by scraping the addresses for the remaining Starbucks locations in each city from the Starbucks website and geocoding2 them. I repeated the process for the addresses of the closed Starbucks locations and added them all to a master file.
I opened this file in Python and drew 100 meter circles around each [open and closed] Starbucks location. I then downloaded the "Crimes in X City" (or equivalent database) from the municipal websites and again used a bit of Python to filter the files down to only those crimes that took place within 100 meters of a Starbucks location.


This approach essentially allowed me to compare the crime level at closed Starbucks locations against the crime level at open Starbucks locations. Unfortunately, I wasn’t able to do an address-for-address comparison between closed and open stores because all three cities blur their crime datasets to the block level for privacy reasons. So I settled for block-for-block comparisons.

The results put paid to the idea that Starbucks closed these locations exclusively out of concerns for crime. Take Los Angeles for example. The LA crime database includes an additional “premise code” field that allowed me to drill down even further to crimes that occurred at coffee shops within 100 meters of Starbucks locations. While the process for the other cities may suck in, for example, road rage incidents that happen outside Starbucks locations or pickpocketing that happens a few doors down, the LA analysis is far more targeted to just Starbucks premises.
Eleven Starbucks locations in Los Angeles experienced more crime than the Starbucks location with the most crime among the six that closed. For two of the six closed locations3, there was not even a single police report at a coffee shop within 100 meters of either location. Perhaps this is a data entry error but, even if so, it appears that there's a credible crime argument for closing only one or maybe two of the closed locations in Los Angeles. In other words, if crime was Starbucks' primary motivation for closing stores in LA, there were much better stores to close than the ones that did end up getting axed.
The story is much the same for Portland. Portland tracks police calls to addresses rather than crimes, so the raw numbers for Portland are far higher than those seen in LA or Seattle’s more concise “crimes” datasets4. Plus, I wasn’t able to filter the dataset down by the coffee shop metric from the LA dataset, so it's a bit noisier.
The stores Starbucks closed in Portland sit pretty close to the middle of the distribution of police calls across the city’s Starbucks locations.
I also had to remove the one Starbucks location across the street from the Portland city jail from my analysis because there were over 4,000 police calls to within 100 meters of that location, presumably due to the jail. Including that outlier would have made the rest of the Portland graph look extremely weird and biased.
Anyway, it might not surprise you to learn that Seattle follows the same pattern as Los Angeles and Portland.
Here, there’s only a single closed store that could conceivably called a “high-crime” store. But even that store is not the Starbucks with the most crime in the city, to say nothing of the four other stores that were closed despite having a fraction of the crime level as the stores with the most crime.
All told, the data simply doesn’t bear out Starbucks’ crime claims. At best, data shows that one or two locations in each city had a higher level of crime than other, similarly located Starbucks stores. By no stretch of the imagination were the closed stores the most dangerous Starbucks stores in their cities. For the most part — as shown by municipal data — both closed and open Starbucks stores in Los Angeles, Portland, and Seattle are safe, secure places to work and drink coffee.
As I’ve said throughout this piece, there are a few caveats: Seattle and Portland only track crimes to the block level, crimes or calls to police may not be accurate proxies for how safe a store is, police records could be incorrect or falsified, or perhaps my data scraping, aggregating, and analysis is simply not as accurate as it could be. Nonetheless, despite what the company claims, it appears that crime was not the only reason for the slew of Starbucks closures throughout the country.
As an alternate explanation, the Starbucks union said 42% of recently closed stores “had union activity”.
As mentioned at the top, geocoding turns addresses into coordinates. I did this because addresses are messy, ripe for human error, subject to interpretation, and involve lots of abbreviations. Plus, it’s much easier to work with coordinates than addresses in Python and other analytical tools.
The locations at 1601 Ocean Front Walk in Santa Monica and 8595 Santa Monica Boulevard in West Hollywood, specifically.
The assumption being that police may be called to an address but the parties involved decline to press charges or file a police report or the officers themselves determine no crime was actually committed.


