A Sense of Fulfillment (Centers)
Analyzing the growth of Amazon facilities in Phoenix...from space
Today’s post includes:
An analysis of the absolutely enormous Amazon footprint in southwest Phoenix
USGS land use data demonstrating the explosion of developed land in Phoenix over the past 20 years, partially driven by Amazon
Satellite imagery and measurements showing increasing pollution commensurate with the development of Amazon fulfillment centers
Key Topics: Satellite imagery, pollution, the environment, etc.
Ah, Phoenix. A band, a mythical creature, an actor’s surname, the largest state capital by population in the United States, and the location of the single most Amazon fulfillment centers in any US city.
Phoenix (the city in Arizona) is known for being huge, populous, and growing quickly. In these qualities, Jeff Bezos and Amazon found a ready and willing partner. In much the same way as Phoenix, Amazon has expanded dramatically in the last 20 years, adding employees, growing revenue, and building outposts throughout the country (and world).
Believe it or not, Amazon publishes the locations of its worldwide fulfillment centers - colossal facilities often comprising hundreds of thousands of square feet of real estate. In that list, Arizona’s Maricopa County (where Phoenix is located) is in a league of its own. The county lays claim to 11 separate fulfillment centers, totaling around 135 acres of warehouses, by my count. Virtually all of these centers were built since 2000, in a growth spurt that tracks with the expansion of Phoenix itself.
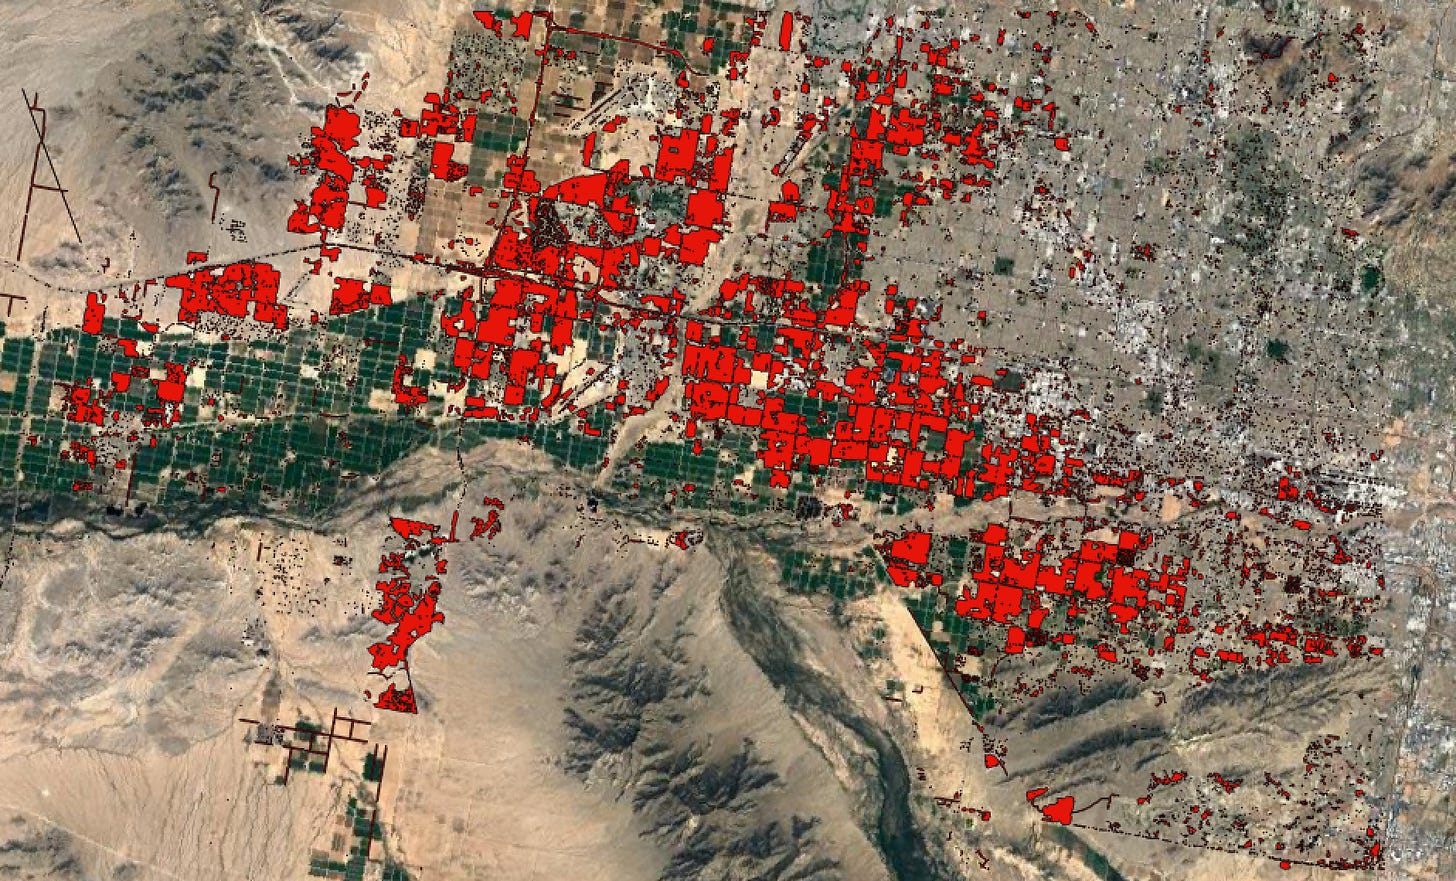
To track this growth, I used some handy US Geological Survey (USGS) data. The USGS periodically publishes land use data derived from satellite imagery that shows quite literally how the use of land changes over time. The land use data for Phoenix reveals an enormous increase in what the USGS calls “developed land”, particularly in southwest Phoenix. The red sections in the image below represent land built up in just the last 20 years.
The USGS breaks down developed land into four sub-categories, all of which saw considerable increases since 2001. The graph below shows, in a different format, the explosion of developed land in southwest Phoenix between 2001 and 2019.
Virtually all of the Amazon fulfillment centers were built on land that was completely undeveloped or agricultural in 2001. The changes are particularly stark in one section of Phoenix that includes no less than seven fulfillment centers in a two-mile radius.
Satellite imagery from this year shows a nearly entirely developed block of land (I took the liberty of marking the seven fulfillment centers).
Less than 18 years previously, the area was at least half agricultural, with only sporadic developments here and there. Strikingly, in this 2003 image, virtually all of the land on which the Amazon fulfillment centers would later sit is either farmland or undeveloped. The area’s north-south artery, Route 2021, had also not yet been built.
Only 10 years before that, the area was downright rural:
The USGS land use overlay for this section of Phoenix shows exactly how developed the area has become in the last 20 years:
But how has runaway development affected the good people of this fair city? Well, if you have asthma, COPD, or any type of heart or lung ailment, it hasn’t been great. Pollution throughout Phoenix, but especially in western Phoenix, has skyrocketed, hand-in-hand with development.
By virtually every measurement on the books - ozone, aerosols, nitrogen dioxide, carbon monoxide - Phoenix has terrible pollution2. While I personally can’t prove that development causes pollution (though an Actual Scientist might be able to), the correlation between highly - and recently - developed areas and pollution is clear.
Using Google Earth Engine, I composed a few images showing mean pollution levels for a few different categories in Phoenix from January 1, 2019 to December 31, 20193. While pollution across the city is quite bad, there are noticeable concentrations in south and west Phoenix along the Interstate 10 and Route 60 corridors. Both regions experienced significant development since 2000.
I overlaid the Amazon fulfillment center locations to correlate Amazon’s construction in the city (and construction at large) with pollution:


While the population of Phoenix has gotten the short end of the stick from the city’s construction, Amazon’s real estate gamble has paid off handsomely.
Maricopa County property records show the value of one fulfillment center, PHX5, has increased by almost 37% since just 2018. The value of another, PHX3, has increased by 68%, while a third, AZA5, increased by 47%. In 2021, Amazon owned over $168 million worth of real estate in Phoenix alone.
The success of these fulfillment centers has prompted even pricier Amazon investments in the Phoenix exurbs. A robotics facility was built in Goodyear, Arizona in 2020 and Amazon plans to increase the total number of Amazon facilities in that town to five by 2022.
The effect this additional construction will have on the Phoenix landscape, environment, and population remains to be seen.
It’s technically a ring road, but in this area it runs north-south.
But don’t just take my word for it! The American Lung Association’s State of the Air report ranks Maricopa County as the fifth-worth place in the country for ozone pollution and the eighth-worst place in the country for particle pollution.
I chose 2019 because the loss of traffic and industrial activity during the pandemic in 2020 skewed the data and, obviously, there’s not a full year’s worth of data for 2021 yet.


